

Emergency Post: Trading Large Gaps Down!
Emergency Post: Trading Large Gaps Down!
Perhaps... there is no need to panic?


I’m writing this around 7 AM EST where ES was down nearly 1% from yesterday’s close (at 4601ish), currently trading around the low 4580s. This could be due to the fact that Fitch has downgraded U.S. credit from AAA to AA+, but it certainly doesn’t help that the market has been propped up on shorts since about mid-July! I thought to myself, wow, I really don’t know what gap down days really look like. So I thought I’d get into it in this post.
The Data
Delving into AMT JOY’s backend, I whipped up a simple scan to grab all sessions with a gap down of 1% or more (soon you’ll be able to do this yourself in the client directly). Here’s what AMT JOY found:
Dates of all sessions with a gap down of 1% or more:
Wednesday, January 25, 2023 neutral extreme up 1.128526645768025
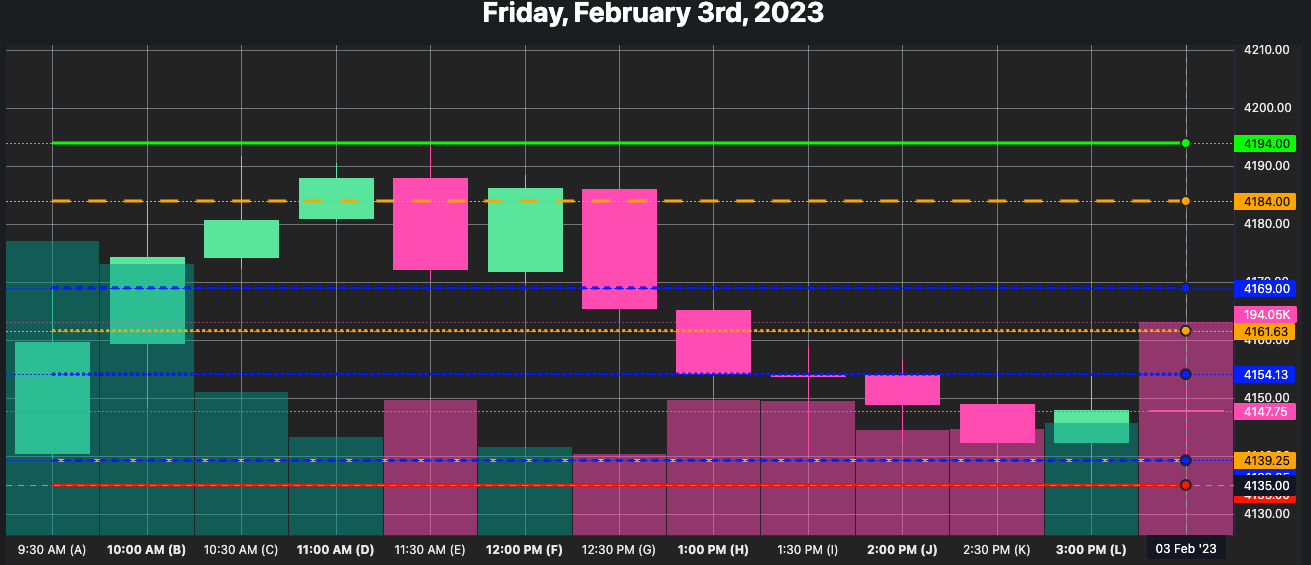
Friday, February 3, 2023 neutral structure none 0.1750996256490762
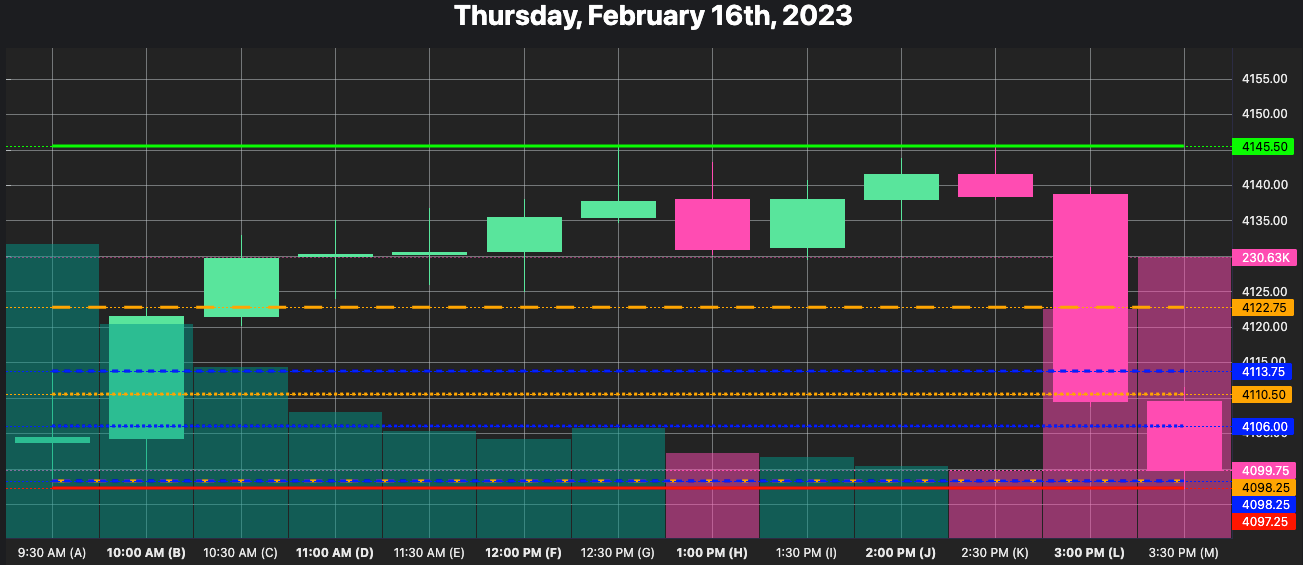
Thursday, February 16, 2023 neutral structure none -0.0974718245507158
Wednesday, February 22, 2023 neutral structure none -0.21825891743576953
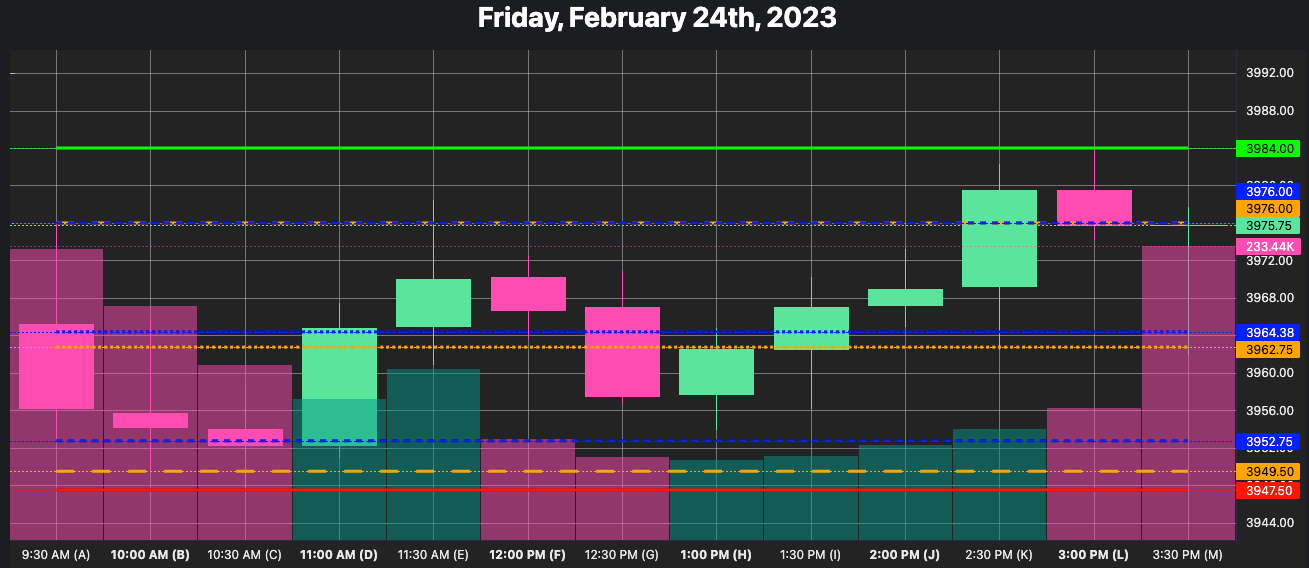
Friday, February 24, 2023 neutral structure none 0.2648004539436353
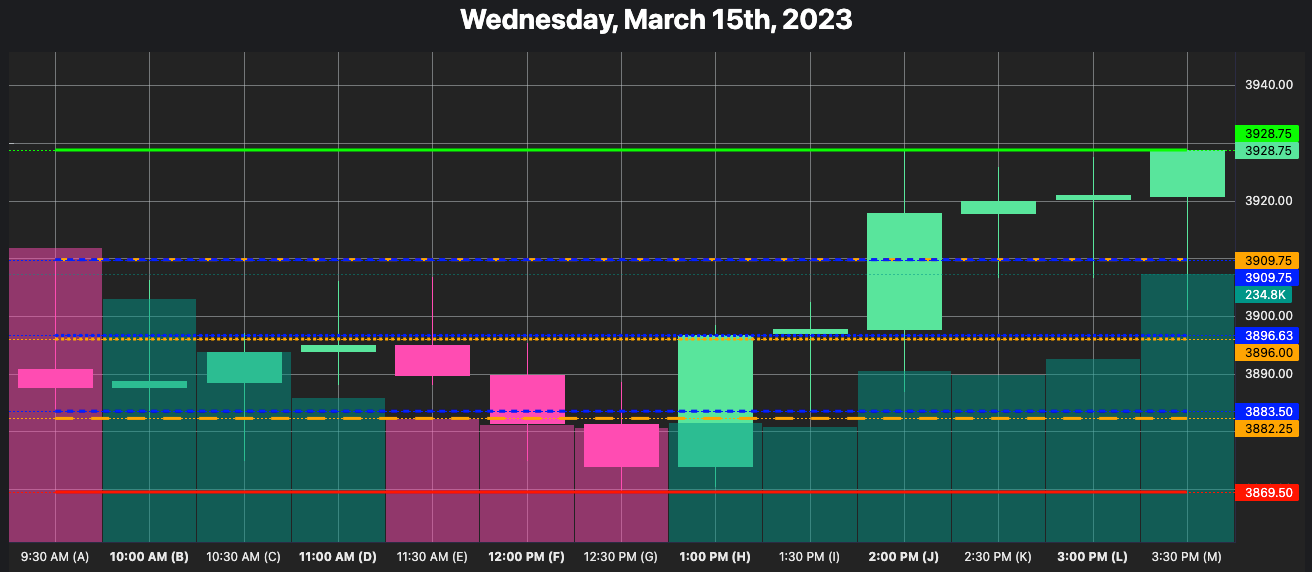
Wednesday, March 15, 2023 neutral extreme up 0.9766754481783718
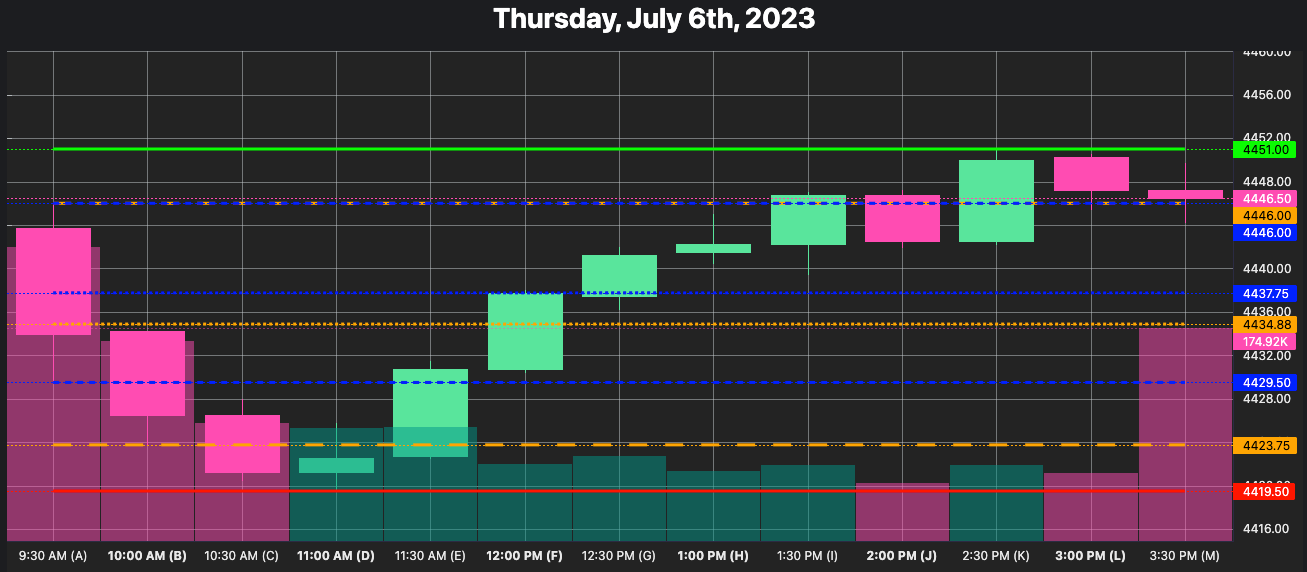
Thursday, July 6, 2023 neutral extreme up 0.061884669479606184
Average return: 0.33%Some notes on this data:
all 7 sessions are neutral structure
of these, 3 are neutral extreme, while 4 are the standard neutral
for all 3 neutral extreme sessions, the bias is up (meaning we close above the IB!)
the session with the best return was 0.98% (!!!)
the session with the worst return was -0.09% (!!!)
the average return of all sessions is 0.33%
average low went 0.44% below the open
average highs went 0.79% above the open
So, it would seem the reflexivity of markets and responsive buying is definitely present in sessions following a large gap down according to this data. Let’s take a look at each of these sessions as charted by AMT JOY:
Wednesday, January 25, 2023: https://amtjoy.com/session-lab/?session=2023-01-25

Friday, February 3, 2023: https://amtjoy.com/session-lab/?session=2023-02-03
Thursday, February 16, 2023: https://amtjoy.com/session-lab/?session=2023-02-16
Wednesday, February 22, 2023: https://amtjoy.com/session-lab/?session=2023-02-22

Friday, February 24, 2023: https://amtjoy.com/session-lab/?session=2023-02-24
March 15, 2023: https://amtjoy.com/session-lab/?session=2023-03-15
Thursday, July 6, 2023: https://amtjoy.com/session-lab/?session=2023-07-06
In general (and speaking very broadly here) it appears two main types of days occur:
Continued trend of gap down in liquidation until some sort of key support / supply level is found, followed by a rally into the close
More responsive buying at or near the beginning of the session, with risk of liquidation in the last half, but usually the last quarter of the session.
Scenarios
So, in today’s session, like any other: I wouldn’t rush into any positions in either direction. Likely, the world is not ending and the end is not nigh. Let’s use statistics however to see some possible levels, looking at average lows and highs from these potentially emotional sessions.
If we open around 4555, look for 4535 as a potential LOD, and 4590 as a potential HOD → more valid according to this post’s data
If we open around 4580, look for 4560 as a potential LOD, 4616 as a potential HOD → less valid since the gap down would only be about -0.45%!
Best of luck out there!
-Chris
Update: it looks like indeed in the ON session we found supply around those 4550s. Already trading back above 4580!
A reminder that I am still ultimately a beginner to intraday trading and trading futures. This is not an alert service and none of this is financial advice.